

LiDAR-driven digital twins for urban intelligence.
One flight over your city gives you point clouds, terrain models, orthophotos and 3D buildings — and a twin you can flood, light and stress-test before you build.
Light, measured a million times a second.
LiDAR — light detection and ranging — fires laser pulses at the Earth and times their return. Each echo becomes a point with precise X, Y and Z coordinates and an intensity value.
What it is
- Airborne, mobile and terrestrial sensors
- Millions of pulses per second
- X, Y, Z and intensity for every return
- Dense 3D point clouds of surface and structure
From raw data to twin
- Classified point clouds
- Terrain models: DTM and DSM
- 3D buildings to CityGML LOD1–LOD4
- Orthophotos and geospatial databases
Why it's the standard
- Accuracy down to millimetre level
- Complete 3D structural geometry
- Penetrates vegetation to bare earth
- Works with GIS and BIM platforms
Why LiDAR simulation changes everything.
The same data, endless applications. Real decisions before real consequences.
Accuracy
LiDAR terrain precision
Faster planning
Compared with traditional surveys
Cities worldwide
Already run on LiDAR digital twins
Cost saving
On disaster response
Five levels of detail, one building.
3D city models are classified by level of detail (LOD). Choose a level to see what each adds.
Our six-step twin workflow.
A proven method that turns physical environments into accurate, interactive 3D replicas for urban analysis.
- 01LiDAR data acquisition
Manned, unmanned, mobile and terrestrial capture.
- 02Point cloud processing
Strip alignment, georeferencing, noise removal.
- 03Point cloud classification
Ground, building, vegetation, water, road.
- 04Terrain models
DTM, DSM and contour generation.
- 053D city generation
Vectorised footprints to CityGML LOD models.
- 06Urban simulation & apps
Flood, wind, solar, mobility and more.
Data products from real NEPC surveys.
Every deliverable below comes from the same acquisition — pick one to view it.
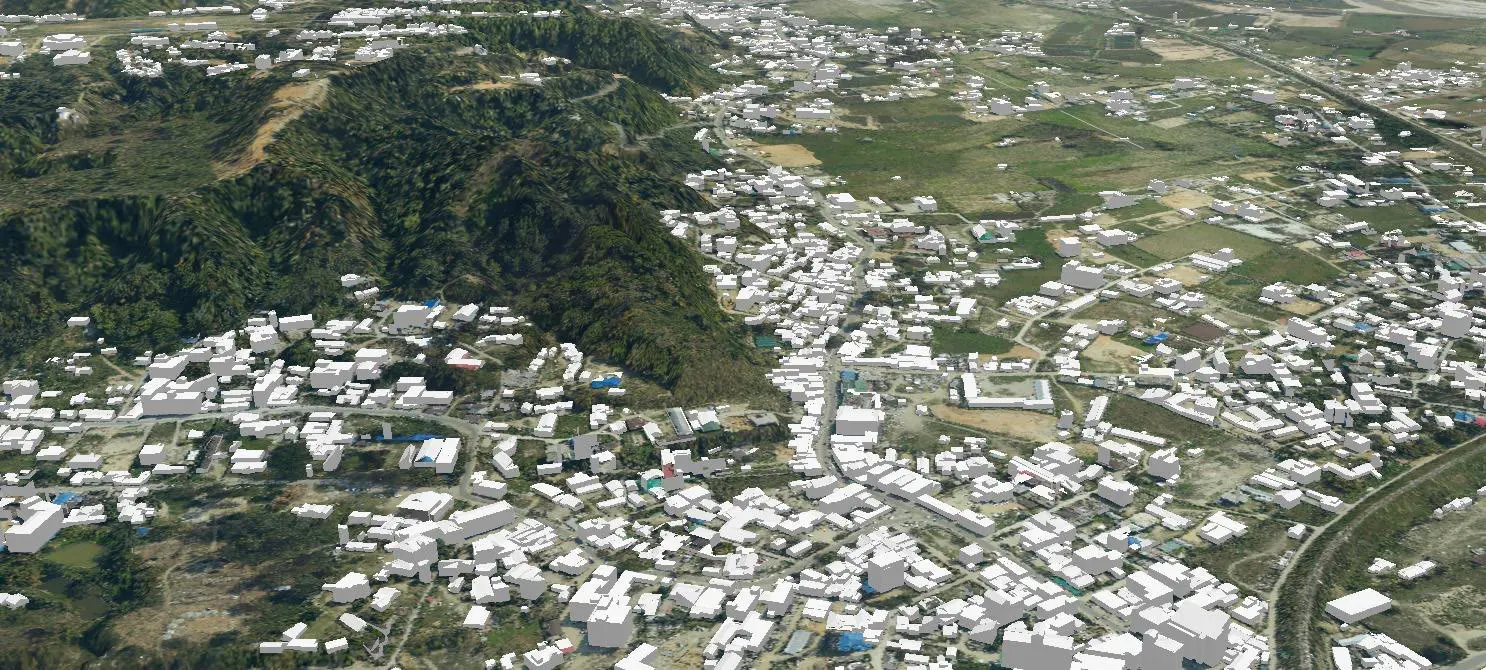
LOD2 city model — every building with its true roof form.
Run the city before you rebuild it.
Representative use cases of LiDAR-based simulation, with published evidence of impact.
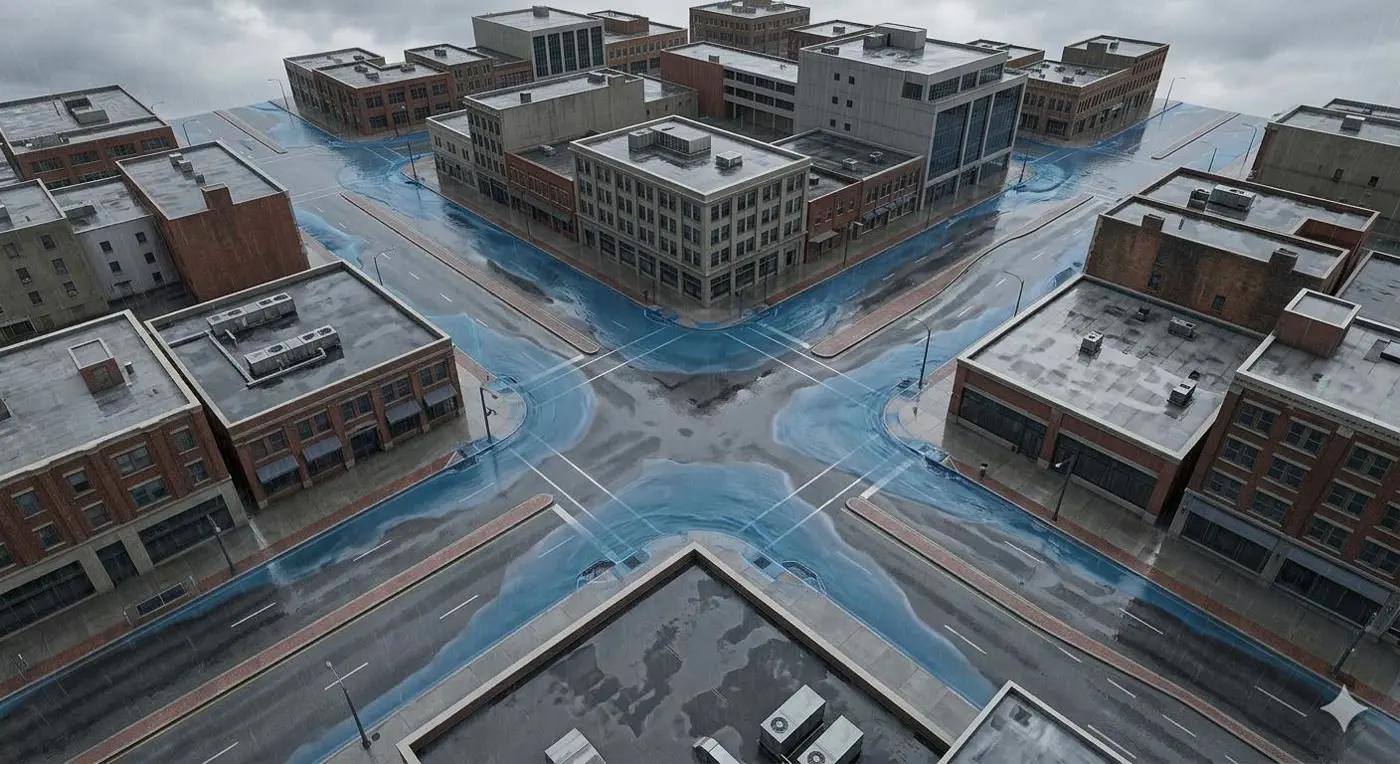
Flood risk analysis & inundation mapping
Water follows the terrain, so precise terrain means precise flood models.
- Identify flood-prone zones with DTM and hydrological flow analysis
- Simulate rainfall–runoff at building and street level
- Map expected inundation depth during extreme events
- Test flood defences virtually before construction
- Plan evacuation routes and emergency preparedness
- Assess impact on roads, hospitals and power stations
Digital-twin flood management systems have cut flood response times by up to 40%, simulating depth, extent and velocity street by street.
Sources: ResearchGate 395301405 · ScienceDirect · Taylor & Francis
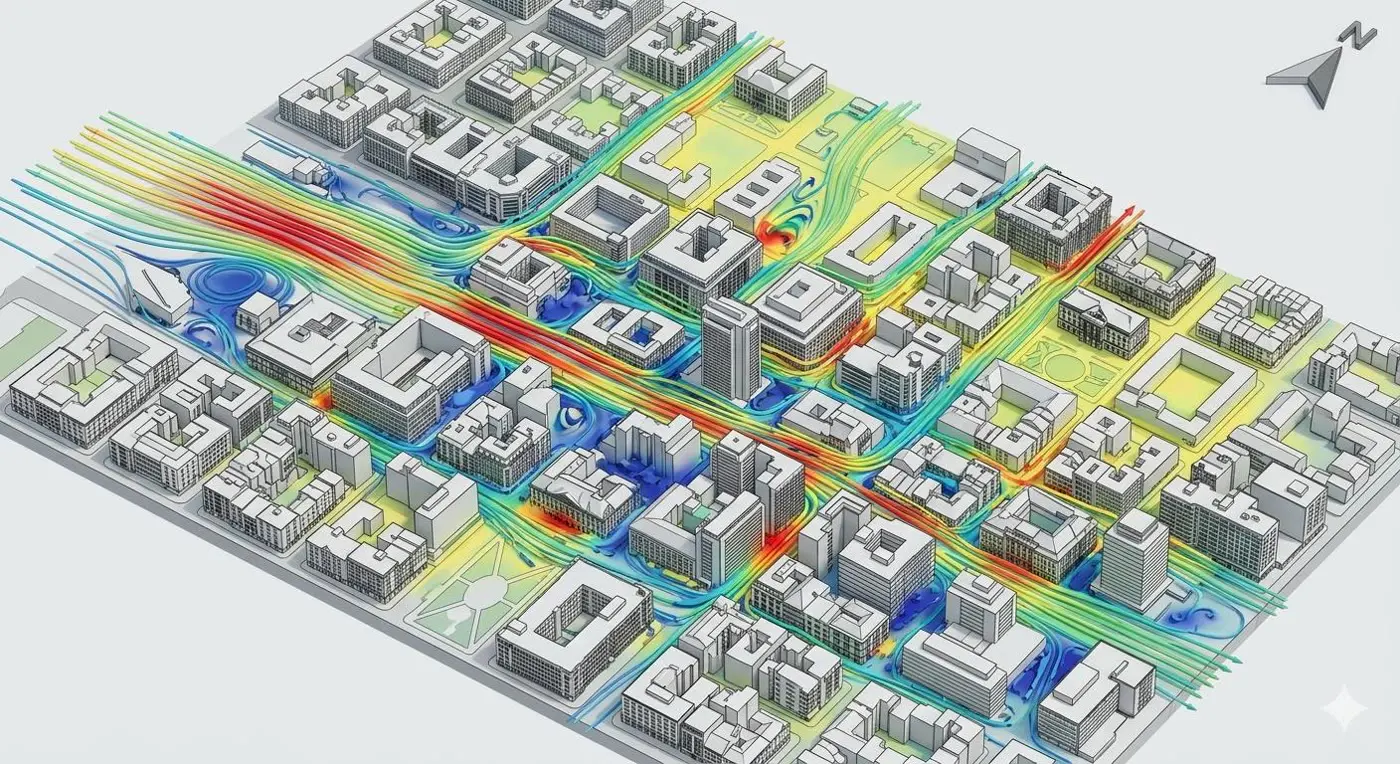
Wind flow simulation & urban microclimate
Accurate building geometry feeds CFD models that predict airflow through urban canyons.
- Wind speed and direction at pedestrian level
- Pressure concentrations on high-rise facades
- Building placement for natural ventilation
- Comfort zones in public spaces
- Wind turbine placement
- Impact of new developments on existing wind patterns
Designed breeze corridors improve pedestrian-level wind velocity by 20–30%, lowering urban heat and building energy demand.
Sources: Building and Environment · Applied Energy
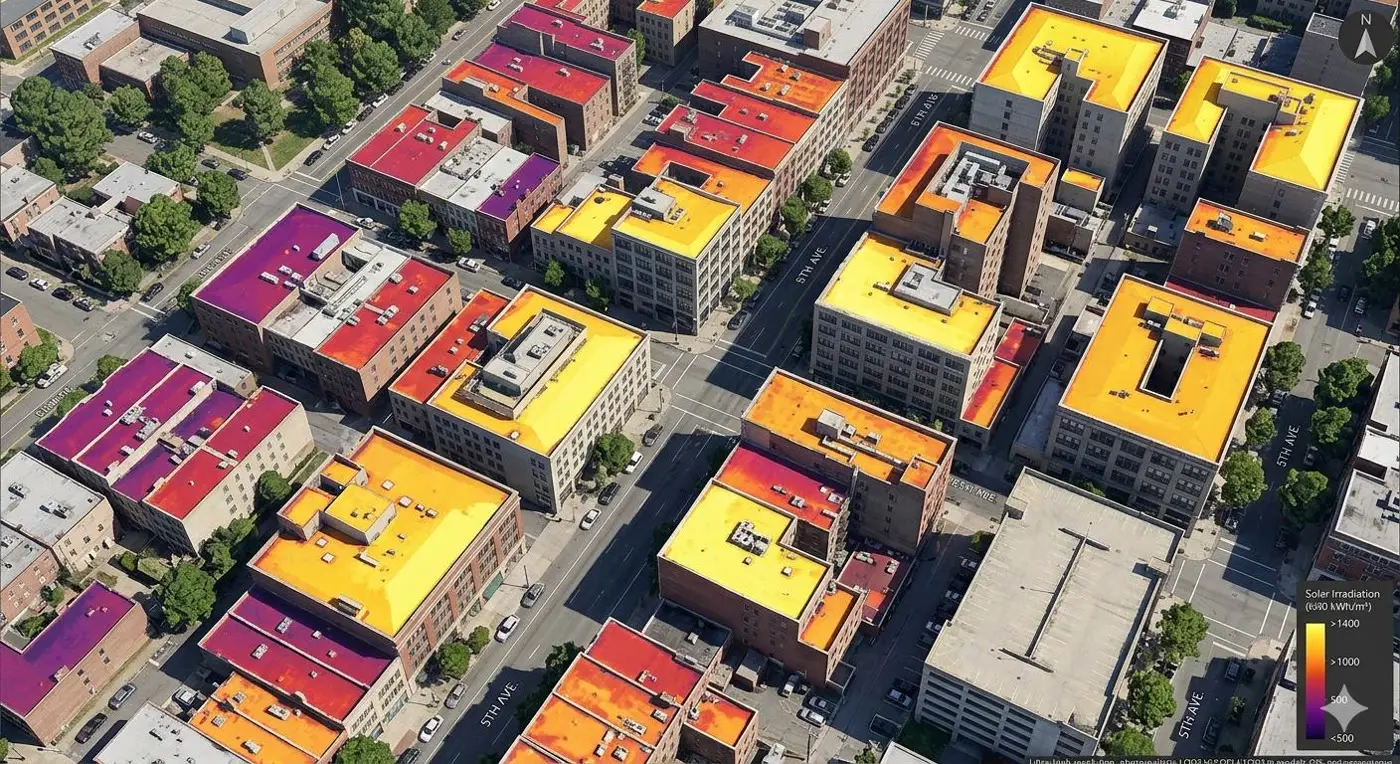
3D solar potential analysis
3D rooftops plus solar irradiance data give PV potential for every surface in the city.
- Annual irradiance on every rooftop
- Shading from neighbouring buildings and trees
- Optimal panel orientation and tilt
- Energy yield and carbon offset per site
- City-wide prioritisation of installations
- Evidence for solar policy and subsidies
Istanbul's rooftops alone could meet 70% of the city's electricity demand; rooftop solar in Shenzhen could cut CO₂ by up to 41.85 million tonnes a year.
Sources: ResearchGate 364414238 · MDPI Remote Sensing · MDPI Remote Sensing
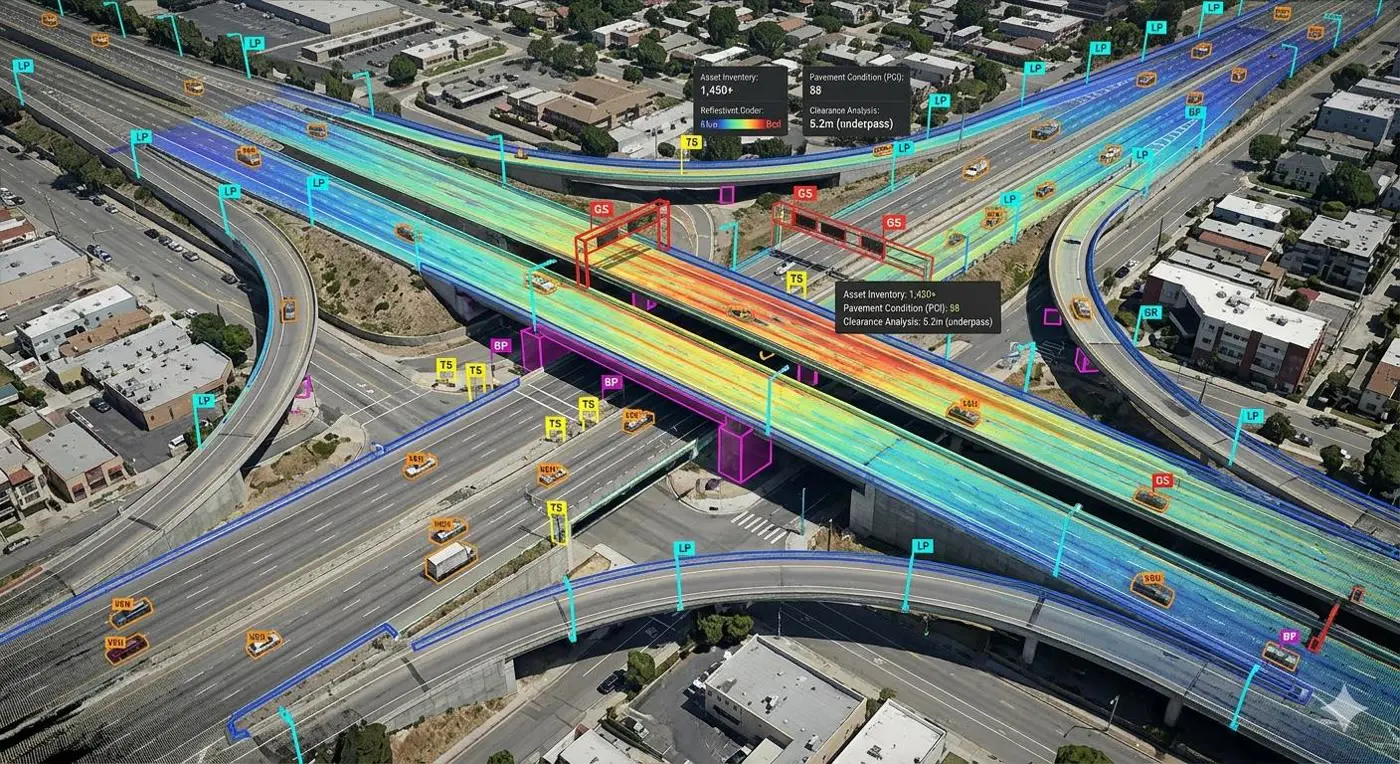
Infrastructure & transport asset management
Continuous monitoring of roads, bridges and transport assets from mobile LiDAR.
- Detect defects before they become failures
- Replace costly manual inspections
- Prioritise maintenance by condition
- Extend infrastructure lifespan
- Data-driven budgets across whole networks
Mobile LiDAR surveys let agencies prioritise maintenance and make network-wide budget decisions from measured condition, not estimates.
Sources: US DOT ROSAP · IET Intelligent Transport Systems
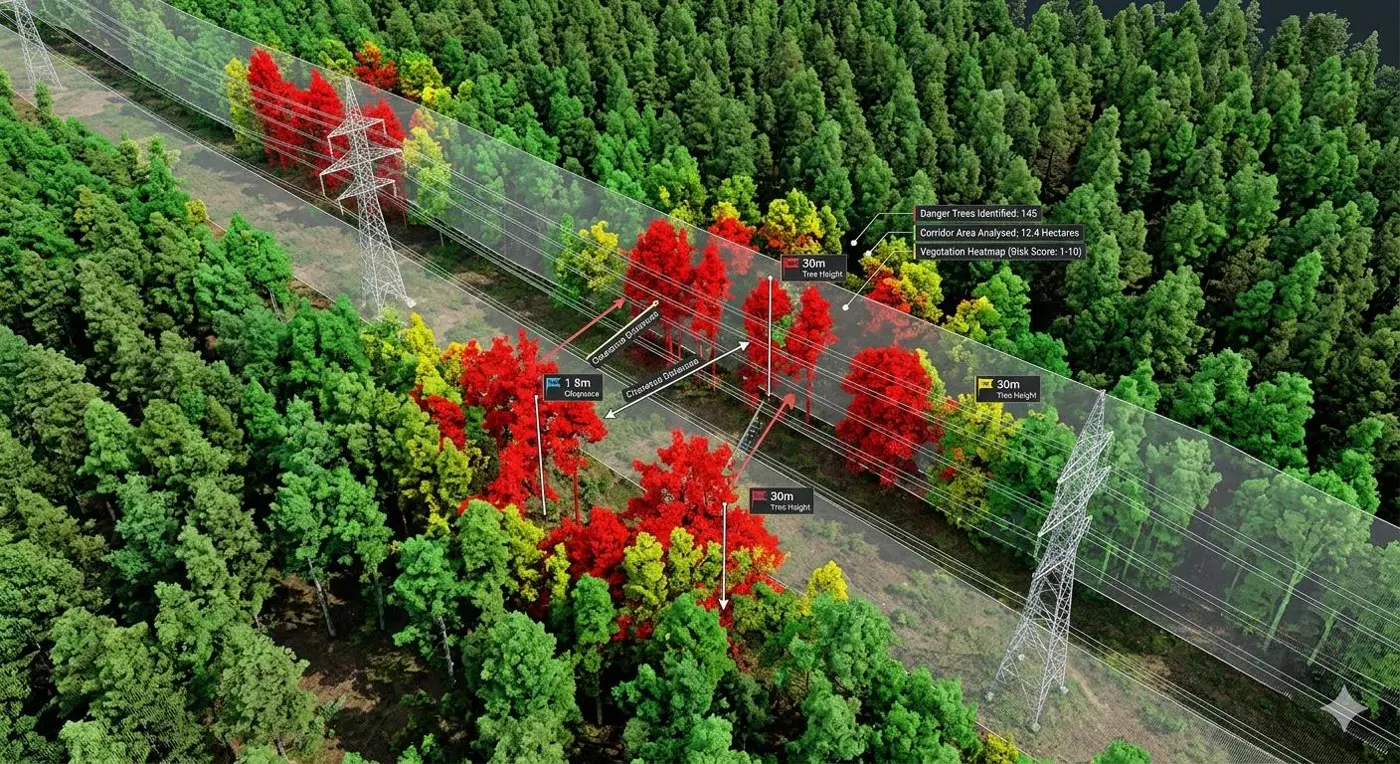
Utility vegetation management
Centimetre-level detection of vegetation encroaching on powerline corridors.
- Find hazards ground patrols miss
- Prevent outages and infrastructure damage
- Prioritise trimming over hundreds of kilometres
- A fraction of the time of traditional inspection
Utilities can assess entire corridors in a fraction of the time of foot patrols and act before vegetation causes an outage.
Sources: Arboriculture & Urban Forestry · IEEE Xplore
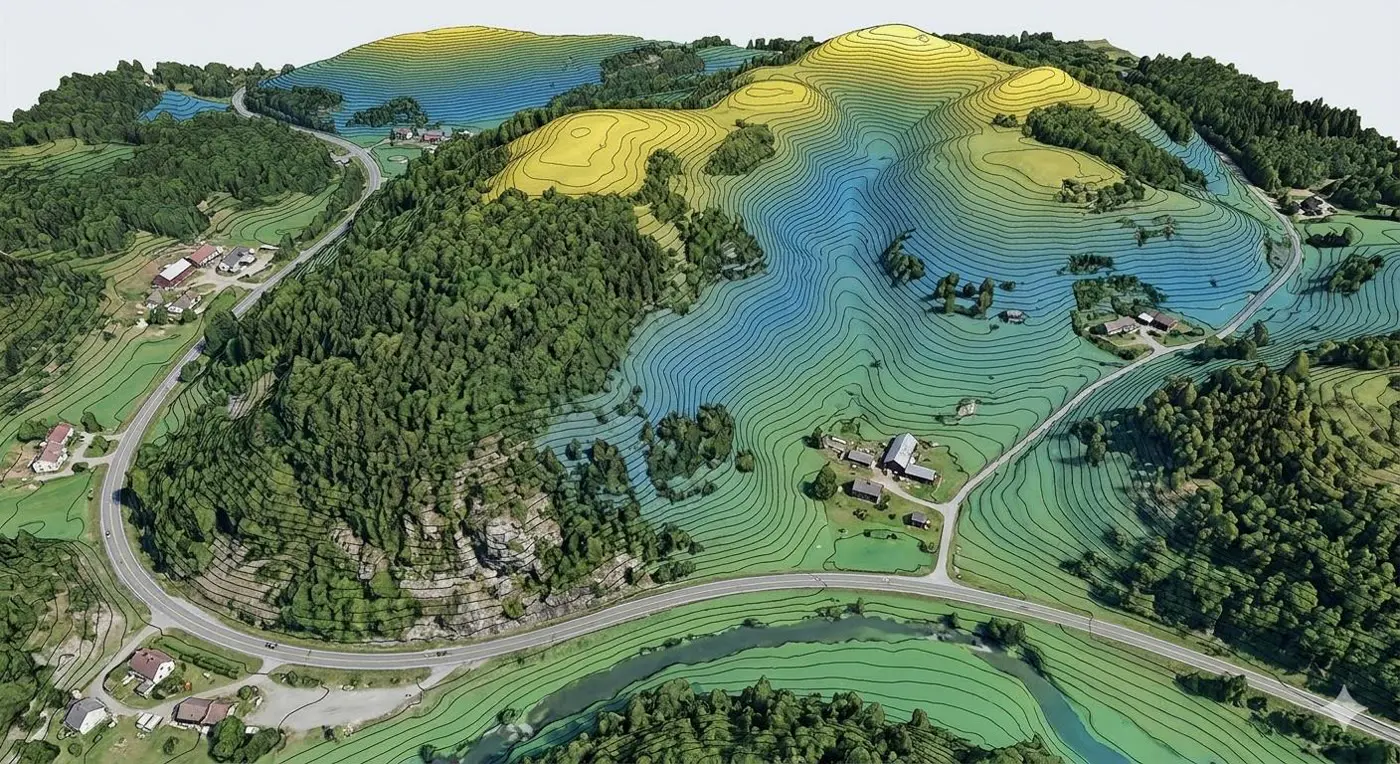
Topographic mapping & contour generation
Centimetre-level terrain across vast areas in a fraction of ground-survey time.
- DEMs, contour maps and drainage models
- Earthwork quantities
- Flood-plain studies
- Construction site planning
- True ground beneath dense vegetation
LiDAR reveals the true ground surface under canopy — terrain that satellite imagery and photogrammetry simply cannot reach.
Sources: USGS · LiDARVisor
What else your LiDAR data can do.
Traditional applications
- Topographic mapping and contours
- DTM / DSM generation
- Urban planning and land management
- Infrastructure development and asset mapping
- Revenue collection and tax assessment
- Cultural conservation and heritage documentation
- Municipal services and utility mapping
- Disaster management planning
Advanced simulation
- Flood risk and inundation mapping
- Wind flow and microclimate
- 3D solar potential
- Blast wave detonation simulation
- Shadow and visibility analysis
- Traffic and mobility simulation
- Emergency response and evacuation planning
- Urban heat island and climate modelling
A geospatial database built for the twin.
System architecture for the spatial database and its sub-systems.
Datasets in
- LAS point clouds
- DEM, DSM
- Orthophoto
- Panoramic imagery
- DGN, DWG, SHP
- CityGML, CityGRID
Spatial database
- Spatial schemes and CityGML schemes
- Import / export
- Web services: WMS, WFS, WCS
- Security management server
- Desktop and web applications
Processing workers
- 3D data acquisition workers
- 3D modelling workers
- CityGML conversion workers
Ready to twin your city?
Tell us the area, the purpose and the deadline. We'll come back with a flight plan and deliverables.
Start a project